
Which Chicken Franchise Makes the Most Money? (2026)
If you're evaluating chicken franchise investments, average unit volume (AUV) is one of the most useful benchmarks available. It measures average...
6 min read
I am Dustin Thompson, and I work on the franchise development team at Jack in the Box. Most weeks I am on the phone or across the table from people who are weighing a seven figure decision, and the conversation almost always opens on the same question. Which fast food franchise actually makes the most money?
It is a fair question, and a messy one. People throw around system sales, store counts, and revenue figures as if they all mean the same thing. They do not. So I rebuilt this comparison from the ground up using the cleanest single yardstick the industry has, average unit volume, and I pulled the numbers from sources you can check yourself: the most recent QSR 50 report and, for our own brand, the Item 19 figures in the Jack in the Box Franchise Disclosure Document that I hand to candidates.
Average unit volume (AUV) is the fairest way to compare brands head to head, because it measures the yearly sales of a single typical restaurant rather than the size of the whole system.
In the 2025 QSR 50, Whataburger and McDonald's report the highest blended AUVs among the brands here, both close to $4.0 million, with Chipotle next at roughly $3.2 million.
AUV is a sales figure, not a profit figure. Food, labor, rent, royalties, and advertising all come out before anything reaches an owner.
Jack in the Box publishes its franchise sales in Item 19 of the FDD, broken into tiers, so prospective owners can see the full range rather than a single headline number.
A higher AUV does not guarantee a better business. The right read is to pair the sales figure with the brand's cost structure and to talk to current franchisees in your market.
Here is the trap I watch people fall into. They see a brand with billions in system sales and assume each store is a gold mine. System sales just tell you the brand is big. A 19,000 unit sandwich chain can post huge system sales while each store sells a fraction of what a high volume burger location does.
Average unit volume cuts through that. AUV is the average yearly sales of one restaurant. It lets you compare a 13,000 store giant against a 550 store regional brand on equal footing, because you are looking at the same thing in both cases: what a single typical location rings up in a year.
One caution before the numbers, and I say this to every candidate. AUV is revenue, not take home. It is the top line. Everything that runs a restaurant, the food cost, the crew, the rent, the royalty, the marketing fund, all of it comes out of that figure. So treat AUV as the starting point of the analysis, not the finish line.
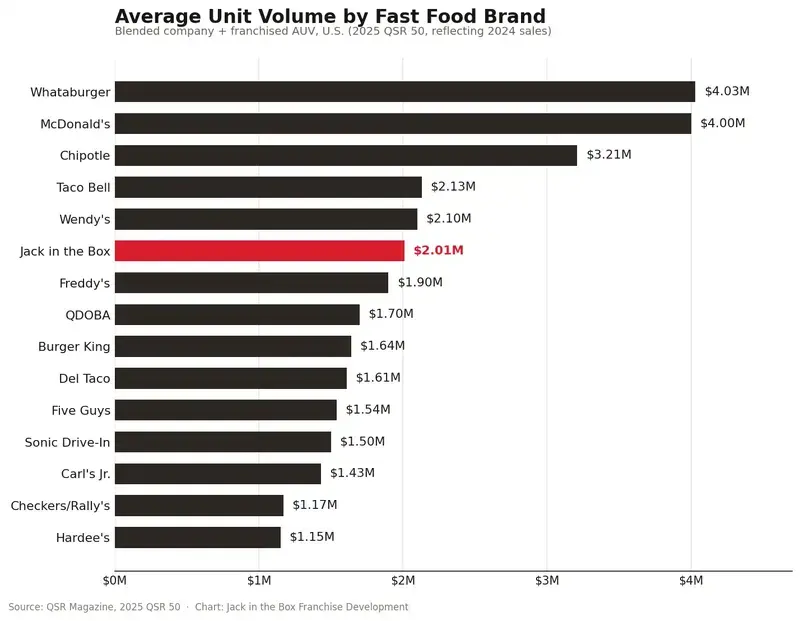
The chart below ranks the brands from the original version of this guide by AUV, using the 2025 QSR 50, which reflects 2024 U.S. sales. The figures are blended, meaning they combine company run and franchised locations. I put Jack in the Box in red so you can see where we sit in the pack.

Average unit volume by brand, blended company and franchised, U.S. Source: QSR Magazine, 2025 QSR 50. Original chart by the Jack in the Box franchise development team.
|
Brand |
Category |
AUV |
|---|---|---|
|
Whataburger |
Burger |
$4.03M |
|
McDonald's |
Burger |
$4.00M |
|
Chipotle |
Mexican / fast casual |
$3.21M |
|
Taco Bell |
Mexican |
$2.13M |
|
Wendy's |
Burger |
$2.10M |
|
Jack in the Box |
Burger |
$2.01M |
|
Freddy's |
Burger |
$1.90M |
|
QDOBA |
Mexican / fast casual |
$1.70M |
|
Burger King |
Burger |
$1.64M |
|
Del Taco |
Mexican |
$1.61M |
|
Five Guys |
Burger |
$1.54M |
|
Sonic Drive-In |
Burger |
$1.50M |
|
Carl's Jr. |
Burger |
$1.43M |
|
Checkers / Rally's |
Burger |
$1.17M |
|
Hardee's |
Burger |
$1.15M |
AUV figures above are reported by QSR Magazine and represent brand sales averages. They are not a representation of the income any individual franchisee has earned or will earn.
Two names sit at the top of the burger category, and they get there very differently. McDonald's reports an AUV near $4.0 million across more than 13,000 U.S. locations, a remarkable feat of consistency at that scale. Whataburger lands right beside it, but with a far smaller footprint concentrated in the South, which tells you those stores are doing heavy volume per location.
From there the category spreads out. Wendy's sits around $2.1 million. Burger King reports about $1.6 million, Sonic Drive-In about $1.5 million, and the CKE pair, Carl's Jr. near $1.4 million and Hardee's near $1.1 million. Freddy's, a much younger steakburger and custard brand, reports about $1.9 million, which is strong for its size and one of the more interesting movers since the earlier version of this guide. Checkers and Rally's, built around a small footprint double drive thru, round out the lower end at about $1.2 million.
Jack in the Box reports an AUV of roughly $2.0 million in the QSR 50. I will get into our own FDD figure in a moment, because it tells a more useful story than a single number.
Chipotle is the standout here at about $3.2 million per restaurant, and the company has publicly said it wants to push toward $4 million, according to QSR Magazine's 2025 report. Taco Bell follows at about $2.1 million across a very large U.S. base. QDOBA reports around $1.7 million and Del Taco around $1.6 million. Note that a few brands from the original list, including Moe's Southwest Grill, did not appear in the 2025 QSR 50 ranking, so I left them out rather than carry forward stale figures from the original blog post.
This is the part I can speak to firsthand, because these are the numbers I work with every day. Rather than lean on a blended industry average for our brand, I went to the source I trust most, our 2026 Franchise Disclosure Document. In Item 19, we report historical sales for our franchised restaurants in the continental U.S., and we break them into thirds so you can see the spread instead of a single tidy average.
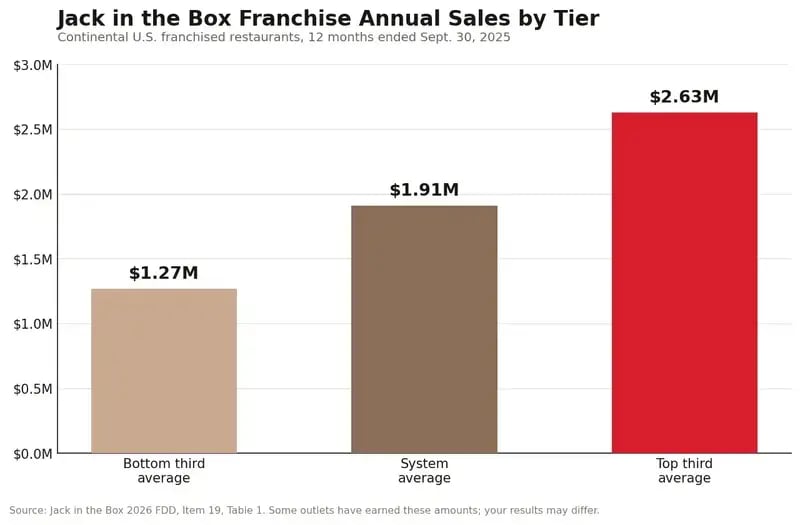
Jack in the Box franchised restaurant sales by tier, continental U.S., 12 months ended September 30, 2025. Source: Jack in the Box 2026 FDD, Item 19, Table 1. Some outlets have earned these amounts; your individual results may differ, and there is no assurance you will earn as much.
For the year ended September 30, 2025, the system wide average for those restaurants was about $1.91 million. The top third averaged about $2.63 million and the bottom third about $1.27 million. I show people the full range on purpose. A single average can hide a lot, and an honest conversation about a franchise starts with the spread, not just the midpoint.
How to read an Item 19. The figures above are historical sales for existing restaurants. They describe what some locations have done, not what a new restaurant will do. We make written substantiation available on request, and we encourage you to review the numbers with your own attorney or accountant before you draw any conclusions.
If you want the cost side of the equation, our FDD lays that out too. You can read our breakdown of the investment in how much a Jack in the Box franchise costs, and you can learn what the disclosure document covers in our explainer on the Franchise Disclosure Document.
Because sales and profit are different animals. I will use our own disclosed cost categories to make the point concrete, since they are public in our FDD. A restaurant's sales get chipped away by cost of sales, which is the food and packaging, then by total labor, then by operating costs like the royalty, the advertising fund, utilities, and occupancy. What is left over before depreciation, amortization, and rent is what the industry calls EBITDAR, and it is a long way down from the top line.
The practical lesson is that two brands can post identical AUVs and run very different businesses underneath. A brand with a leaner menu and lower labor model can keep more of each sales dollar than one with a sprawling menu and higher food cost. That is exactly why you cannot rank franchises on AUV alone, and why the cost structure deserves as much attention as the sales figure.
What is average unit volume in fast food franchising?
Average unit volume is the average yearly sales of a single restaurant across a brand. It is a sales figure rather than a profit figure, so it shows revenue before food, labor, rent, royalties, and advertising are subtracted.
Which fast food franchise has the highest AUV in 2026?
Among the brands compared here, the 2025 QSR 50 puts Whataburger and McDonald's at the top, both near $4.0 million per restaurant, with Chipotle next at about $3.2 million.
Does a higher AUV mean a franchise is more profitable?
Not by itself. AUV measures sales. Two brands with similar sales can keep very different amounts after costs, so you have to pair the sales figure with the cost structure in the FDD.
Where can I find a brand's real franchise sales numbers?
In Item 19 of the Franchise Disclosure Document, if the brand publishes a financial performance representation. You can also request written substantiation for those figures.
How much does it cost to open a Jack in the Box?
We break the full investment down in our guide on how much a Jack in the Box franchise costs, drawn straight from Item 7 of our FDD.