
The Burger Franchise QSR Industry

A working brief on the quick-service restaurant segment: how big it actually is, where it is growing, where it is slowing, and how Jack in the Box awards territory inside it.


The short version

The numbers behind the opportunity, and why brand strength matters more than ever.

  1. 1

    Quick service is the largest sector in U.S. franchising by unit count, at roughly 281,000 establishments and 5.2 million employees (FRANdata / International Franchise Association, 2026 Franchising Economic Outlook)

  2. 2

    It is also projected to grow in 2026, at 0.5% output growth. 

  3. 3

    Global QSR revenue is projected at $1,147.83 billion for 2026, with the U.S. portion at roughly $343.09 billion. (Fortune Business Insights

  4. 4

    Nearly 75% of all U.S. restaurant traffic is now off-premises: takeout, drive-thru, or delivery. (National Restaurant Association


  5. 5

    42% of restaurant operators reported their business was not profitable in 2025. (National Restaurant Association, 2026 State of the Restaurant Industry

None of the above is a representation of financial performance. Restaurant results depend on the operator, the site, and the market. Financial performance information, if any, appears only in Item 19 of our Franchise Disclosure Document.

What is a QSR Franchise, and How is it Different from Fast Casual?

A quick-service restaurant, or QSR, is a limited-service restaurant where guests order and pay before eating and food is assembled in minutes. Most of the volume moves through a drive-thru, a pickup window, or a delivery handoff rather than a dining room. Fast casual sits one step up: guests still order at a counter, but prep windows are longer, checks run higher, and the dining room is built to hold people rather than move them through.

The distinction gets blurry in the data. The U.S. Census Bureau files both formats under NAICS 722513, limited-service restaurants, which is why two credible industry reports can publish very different "QSR market size" numbers and both be correct. Always check the scope before comparing the figure.
A juicy Double Jack Cheeseburger with cheese, lettuce, pickles, tomatoes, onion, ketchup and mustard.

Where Does the Burger Category Sit Inside Quick Service?

Burgers anchor the segment. Fortune Business Insights projects American cuisine, a category dominated by burger and pizza chains, at 59.86% of the global QSR market in 2026. That said, not every burger brand is a QSR. The category spans all three service models, and the differences drive very different real estate, staffing, and throughput requirements.

The distinction gets blurry in the data. The U.S. Census Bureau files both formats under NAICS 722513, limited-service restaurants, which is why two credible industry reports can publish very different "QSR market size" numbers and both be correct. Always check the scope before comparing the figure.

A juicy Double Jack Cheeseburger with cheese, lettuce, pickles, tomatoes, onion, ketchup and mustard.

Burgers are sold across all three restaurant service models, and the model dictates the real estate, the labor build, and where the volume comes from.

Quick service, fast casual, and full service compared across seven operating attributes. Compiled by Jack in the Box Franchise Development, July 2026.
Attribute Quick service (QSR)Subject of this page Fast casual Full service
How guests order Counter, kiosk, drive-thru, or app Counter, kiosk, or app Seated, served at the table
Typical wait Minutes Several minutes Cooked to order
Where volume comes from Drive-thru and off-premises Split, dine-in heavy Dine-in
Dining room role Optional; some prototypes omit it Designed to hold guests Central to the concept
Site footprint Small building, large lot for stacking Mid-size, inline friendly Largest building
Labor model Assembly and speed Assembly with prep depth Full kitchen and front of house
Commonly cited examples Jack in the Box, McDonald’s, Wendy’s Panera, Chipotle Applebee’s, Chili’s

How Big is the QSR Industry in 2026?

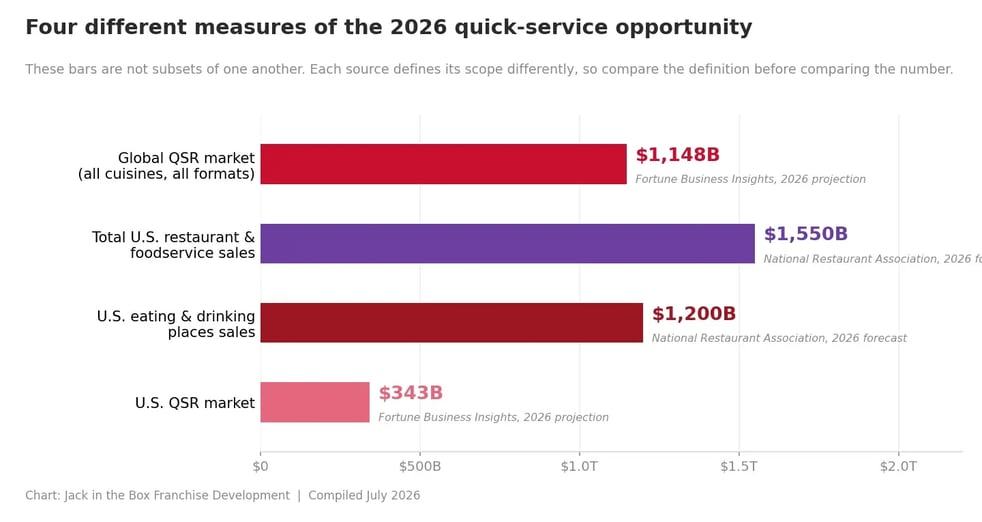
Fortune Business Insights projects the global quick-service restaurant market at $1,147.83 billion in 2026, reaching $2,311.54 billion by 2034 at a 9.14% compound annual rate. It puts the U.S. share at roughly $343.09 billion for 2026. Separately, the National Restaurant Association forecasts total U.S. restaurant and foodservice sales of $1.55 trillion in 2026, with eating and drinking places accounting for nearly $1.2 trillion of it.

Those four numbers are not nested inside one another, and it is worth saying so plainly. Each source draws its boundary differently. The gap between the NRA's 4.8% nominal sales growth and its 1.3% inflation-adjusted growth is the more useful number anyway: most of the increase is menu pricing, not additional guests walking in.
qsr-industry-market-size-comparison-2026


Why does drive-thru and off-premises volume decide so much in this segment? 

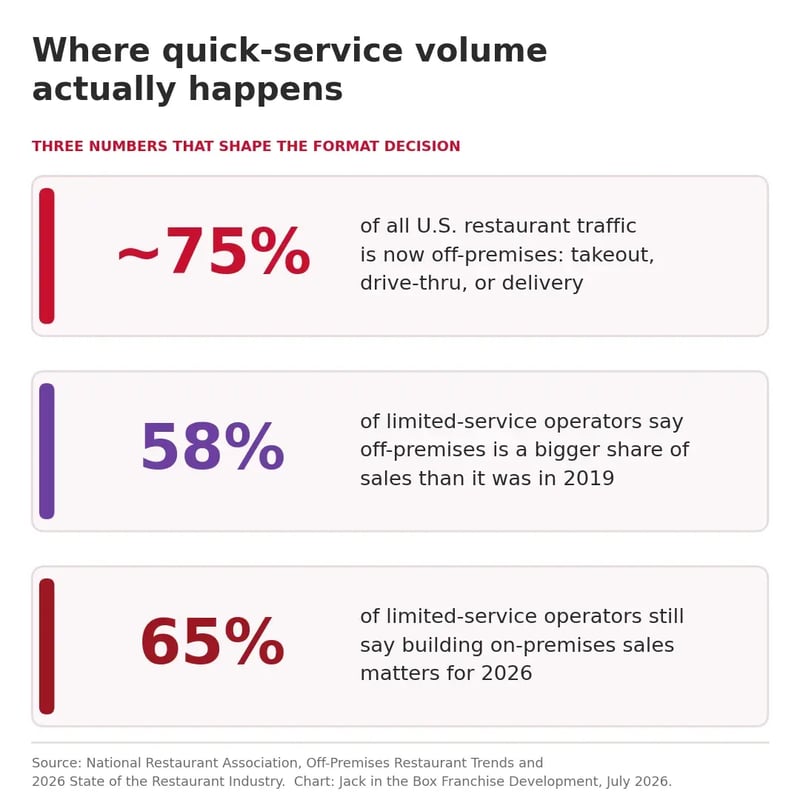
Because that is where the traffic is. The National Restaurant Association reports that nearly 75% of all U.S. restaurant traffic is now off-premises, and 58% of limited-service operators say off-premises makes up a larger share of sales than it did in 2019. In a burger QSR, the drive-thru is not an amenity bolted onto the building. It is the primary throughput system, and the lot has to stack cars without blocking its own ingress.

Worth noting the counterweight: 65% of limited-service operators still say building on-premises sales matters to their 2026 results. Off-premises dominance does not mean the dining room is irrelevant everywhere. It means the format decision is a market-by-market call.


Three stat cards showing that about 75 percent of U.S. restaurant traffic is off-premises, 58 percent of limited-service operators say off-premises is a larger share of sales than in 2019, and 65 percent still say on-premises sales matter for 2026.

What Does a Modern QSR Burger Prototype Have to Solve For?

Our MK12 prototype was designed around those traffic patterns rather than retrofitted to them. Six decisions do most of the work:

Those decisions translate into published site criteria, not preferences. Our preferred criteria for the current prototype: 25,000+ square feet of land, a 1,350 to 2,400 square foot building, 10,000+ population and 3,000+ employment within one mile, $65,000 average household income, and 25,000+ daily traffic counts. A drive-thru is required. Free-standing pads, out-parcels, and end caps all work; we also build convenience store and travel plaza formats.

Publishing the numbers means a candidate can rule a site in or out before spending money on it. More detail on the prototype here, and on whether a drive-thru is required here.


Our Prototype Features:

Is the QSR Burger Market Saturated?

Saturation is a trade area question, not a national one. Nationally, quick service is franchising's largest sector by establishment count, so on paper the category looks full. Inside a five-mile radius the picture changes street by street: competitor drive-thru capacity, which dayparts are actually being served, commute direction, signage sightlines, and residential permitting all vary within a few blocks.

This is why we publish availability by state and DMA instead of describing the country as open. Some states are open statewide. Some are open in one DMA only. Several are not currently being awarded at all, and we say so on the page rather than letting a candidate find out on a call. You can check your specific market here.

One more thing candidates should know before they ask: Jack in the Box does not grant exclusive territories, and you or a partner in your ownership group must reside in the market you operate.
jack-in-the-box-restaurant-interior

Which States are Seeing the Most Franchise Growth in 2026?

FRANdata and the IFA name Texas, Florida, Georgia, Arizona, North Carolina, Colorado, Michigan, Utah, Ohio, and Maryland as the ten fastest-growing states for franchising in 2026, with Michigan, Ohio, and Utah entering that list for the first time. Total U.S. franchise establishments are projected to rise from 832,521 to about 845,000 units, an increase of 1.5%.

I cross-referenced that list against our own development map. Seven of the ten have some level of Jack in the Box availability right now, and two are open statewide. Three are not currently being awarded. Here is the full comparison, and the closed rows are included on purpose.

Seven of the ten states have some level of availability right now. Two are open statewide. Three are not currently being awarded, and those rows are included on purpose.

Ten states named by FRANdata and the International Franchise Association as franchising’s fastest growing for 2026, matched against Jack in the Box territory status. The order follows IFA’s published list, which is a set rather than a ranking. Availability reflects our Available Markets page as of July 29, 2026 and changes as development agreements are signed. Confirm current status before acting on it.
State named by IFA Jack in the Box availability, July 2026 Market page
Texas LimitedWest Texas only Available Markets
Florida LimitedOrlando DMA only Orlando
Georgia LimitedMacon and Savannah DMAs only Atlanta
Arizona Not availableNot currently being awarded Available Markets
North Carolina LimitedCharlotte DMA only Charlotte
Colorado Target growthOpen statewide Denver  |  Colorado Springs
Michigan Target growthOpen statewide Detroit
Utah Not availableNot currently being awarded Available Markets
Ohio LimitedCincinnati DMA only Cincinnati
Maryland Not availableNot currently being awarded Available Markets
 

Frequently Asked Questions


Ready to Get Started?

Please submit the form below to begin your franchising journey with Jack in the Box!